
Meal Delivery Trends: Which Meal Delivery Services Are Most Popular in 2022?

11 min reading - May 26, 2022

Meal delivery services like Uber Eats and DoorDash steadily gained traction prior to COVID-19, but the lockdowns may have acted as a catapult for the online food ordering and delivery platforms. But what do people think are the best meal delivery services? What do people order? What kind of meal delivery trends are we seeing?
Let’s take a look at meal delivery and meal kit industry trends and find out.
Meal Delivery Trends — The Overview
Here are our key findings (with more data to follow):
- Most people ordered about once a week (25%), a couple of times a month (25%), or less than once a month (24%), with the remainder ordering more than once a week (almost 13%) or once a month (13%).
- 55% said that they opt for the food to be delivered to them, whereas 21% chose to pick it up. Almost 25% do a mix of both.
- Friday and Saturday were the most popular days for ordering meal delivery, at 54% and 49% respectively.
- Dinner was overwhelming the delivery service meal of choice with 83%, with lunch coming in a distant second at 39%.
- Most people usually ordered meal delivery with others (31%) or half with others, half by themselves (28%), with only 11% ordering meal delivery by themselves.
The Meal Delivery Service Contenders
We asked the survey respondents which meal delivery services they had used before. Here is a breakdown of their answers: Most respondents — a whopping 81% — had tried DoorDash. Around half of the respondents had tried Uber Eats and Grubhub (55% and 53%, respectively). The drop-off from here is steep. Only 23% of respondents had tried Postmates, and 5% had tried Deliveroo. 4% had tried some “other” service, but that included dealing directly with the restaurant.
- DoorDash — 81%
- Uber Eats — 55%
- Grubhub — 53%
- Postmates — 23%
- Deliveroo — 5%
- “Other” — 4%
We then asked them which meal delivery platforms were their “favorite” or “go-to.” Unsurprisingly, given the numbers we saw with regard to which meal delivery services had been tried, DoorDash led the pack for almost half of all respondents. Uber Eats came in second with 23%, and Grubhub in third place with 15%. Postmates and “Other” had 5% of the vote, and Deliveroo came in last with 3%.
- DoorDash — 49%
- Uber Eats — 23%
- Grubhub — 15%
- Postmates — 5%
- Deliveroo — 3%
- “Other” — 5%
The majority of those who answered “Other” said they contacted places directly or did not have a favorite.
Why Use Meal Delivery Services?
Why do people opt for meal delivery services? After all, most meal delivery services charge some sort of fee for each order or have some paid special to lower or negate service fees. We didn’t want to take “didn’t want to cook” at face value. Instead, we wanted to delve deeper, so we asked meal delivery service users why they used them This is what we found.
- 52% chose meal delivery because they had been “too tired to cook.”
- 50% said that they just didn’t want to leave home.
- 38% said that they didn’t have the time to cook.
- Almost 23% said they opted for meal delivery to minimize the risk of getting sick — avoiding germs and, of course, minimizing the risk of catching COVID-19.
- Close to 18% used meal delivery as a way to celebrate a special occasion.
- 16% claimed they didn’t know how to cook (or weren’t very good at it), with close to 14% saying they didn’t have access to appliances or tools for cooking.
- 9% felt that it was cheaper to buy and consume pre-made food rather than buy all the ingredients to cook.
- 7% had “other” reasons for getting meal delivery, including:
- Desiring certain cuisine they didn’t know how to cook
- Mobility during the pandemic
- Favorite restaurants not offering their own delivery services
- Being an easy way to feed their children
What Are People Ordering on Meal Delivery Services?
With meal delivery platforms offering an array of cuisines, we wanted to know what type of food people were ordering for delivery. So we asked people who used these platforms what they usually ordered (multiple options). Pizza and Chinese food were the most popular meal delivery choices (59% and 47%, respectively). Next was American and Mexican cuisine, as well as burgers. These three were less than 5% apart — 41% ordered American, while 38% chose Mexican, and 37% opted for burgers. Italian food had 28% of the vote. Sushi (18%), Thai (16%), Barbecue (15%), and Indian (13%) ranked closer to the bottom. The least popular listed types of food? Fish and Vietnamese each got 10%. Finally, 5% of respondents chose the “Other” category; what they tended to order included Mediterranean cuisine and high-end or specialty health items.
- Pizza — 59% (Are we really surprised?)
- Chinese — 47%
- American — 41%
- Mexican — 38%
- Burgers — 37%
- Italian —28%
- Sushi — 18%
- Thai — 16%
- Barbecue — 15%
- Indian — 13%
- Fish — 10%
- Vietnamese — 10%
- Other — 5%
Show Me the Money!
We wanted to know what people spent on meal delivery and how they spent it. This is what they told us.
Monthly Spending
We asked how much meal delivery service users thought they spent on meal delivery services in a month. Almost a third of respondents said they spent $50 or more on meal delivery services every month. The $20-29 range came in second with 17%. The remaining ranges – $40-49, $30-39, $15-19, and $10-14 – were pretty even.
- Most people (30%) spent $50 or more.
- 10% spent $40-$49.
- 11% spent $30-$39.
- 17% spent $20-$29.
- 12% spent $15-$19.
- 7% spent $10-$14.
Group Spending
Since, as mentioned earlier, most tended to order meals with other people (or half the time with other people), we also asked how much they usually spent on a typical order when they were ordering with others. Most (22%) spent $30-$39, with the $50-$59 range a close second at 20%, followed by 18% at $40-49. It seems that the further you get to one end or the other in the price spectrum, the fewer the people. The exception was the 5% of respondents who spent $100 or more on a typical order.
- 22% spent $30-39.
- 20% spent $40-49.
- 18% said they spent $40-$49.
- 13% spent $60-$69.
- 11% spent $20-$29.
- 5% spent $80-$89, and another 5% spent $100 or more.
- 4% spent less than $20.
- 2% spent $90-$99.
In terms of how big the typical group was, the majority at 39% said that it was them with one other person. Groups of 3 and 4 were the next most common, with 23% and 24% of respondents respectively. Handfuls of people had groups of 5 (9%) and 6 (5%).
How People Paid
A large majority — almost half — of meal delivery service users usually paid by credit card, with another 33% paying by debit card. Numbers dropped off for digital payment (like Apple Pay or Google Pay) and cash.
Here are the stats compared to other payment types.
- 47% paid by credit card.
- 33% paid by debit card.
- 12% used digital payment, such as Apple Pay or Google Pay.
- 7% paid with cash.
- 1% paid by other means.
Good Tippers?
Are meal delivery service users generous with the delivery people? It looks like they are. A whopping 59% said that they always tip. 20% of respondents said that they “usually” tip, and 17% said that they “sometimes” tip. Thankfully, a very small minority either rarely or never tipped.
- 20% said that they usually tip.
- 17% said that they sometimes tip.
- 3% said that they rarely tip.
- 1% said that they never tip.
When tipping, more than half of respondents chose to “pre-tip” (when placing the order), although more than a fifth either paid the tip directly to the delivery person at the door digitally or in cash.
- 52% specified the tip when they ordered.
- 24% added a tip when they paid the delivery person at the door.
- 22% tipped in cash at the door.
- 2% tipped using other means.
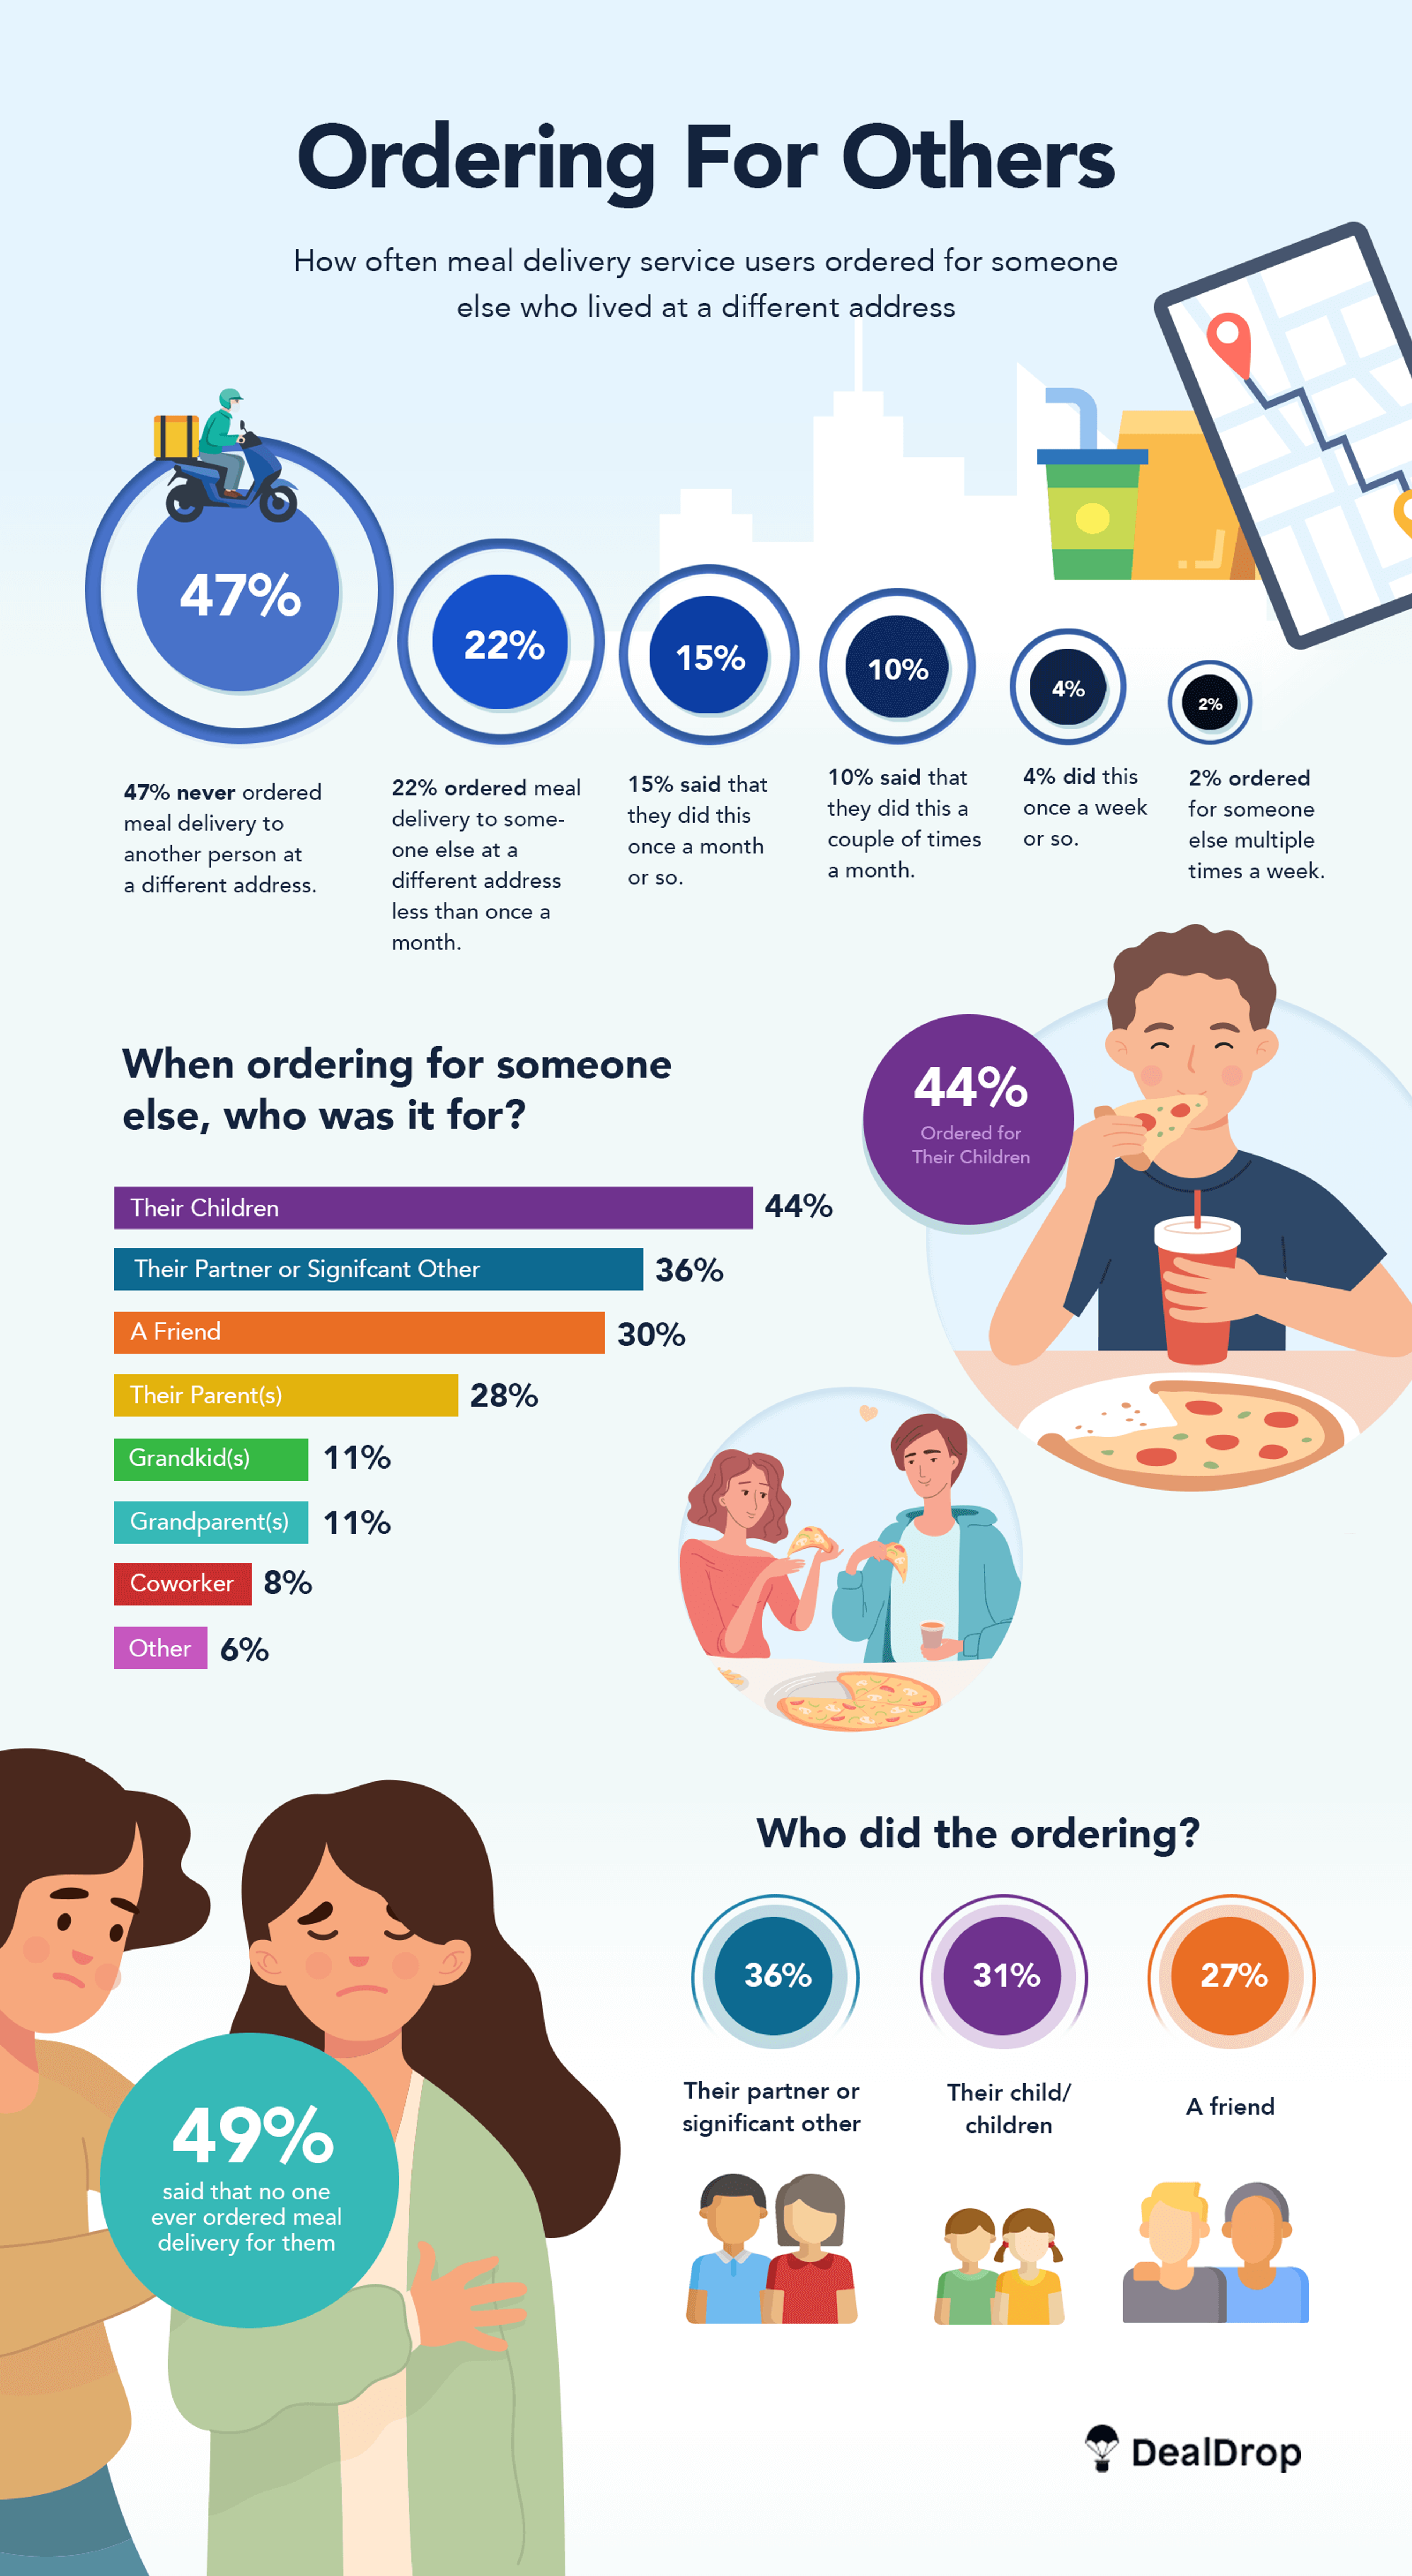
Ordering for Others
We wanted to know how often meal delivery service users ordered for someone else who lived at a different address (so the food wouldn’t be eaten by the person who ordered). This is what we found. Almost half never ordered food for someone else. For the most part, the higher the frequency of ordering meal delivery for someone else, somewhere else, the lower the number of respondents. Understanding this pattern could help optimize delivery routes effectively, ensuring more efficient service.
- 47% said they never ordered meal delivery to another person at a different address.
- 22% said they had ordered meal delivery to someone else at a different address less than once a month.
- 15% said that they did this once a month or so.
- 10% said that they did this a couple of times a month.
- 4% said they did this once a week or so.
- 2% ordered for someone else multiple times a week.
When they did order for someone else, it was most often for their child or children, followed by partners, friends, and parents. We had a few grandparents and grandchildren ordering for each other, and in rare cases, people ordered for coworkers or “other” people.
- Their child/children — 44%
- Their partner or significant other — 36%
- A friend — 30%
- Their parent(s) — 28%
- Their grandchild/grandchildren — 11%
- Their grandparent/grandparents — 11%
- Their colleague or coworker — 8%
- Some other person — 6%
Was this reciprocated? When asked whether someone else ordered meals to be delivered to the respondent for them to eat, this is what we heard. Given the numbers in the previous section, the fact that almost half said that no one ever ordered meal delivery for them was not a shock. Here is how the majority compared to the others.
- 49% said that no one ever ordered meal delivery for them.
- 20% said that someone ordered meal delivery for them less than once a month.
- 14% said that someone ordered meal delivery for them once a month or so.
- 11% said that someone ordered meal delivery for them a couple of times a month.
- 3% said that someone ordered meal delivery for them once a week or so.
- 4% said that someone ordered meal delivery for them multiple times a week.
Who did the ordering? Our survey respondents told us that the meal delivery was ordered by:
- Their partner or significant other — 36%
- Their child/children — 31%
- A friend — 27%
- Their parent(s) — 20%
- Their grandchild/grandchildren — 15%
- Their grandparent(s) — 13%
- A colleague or coworker — 8%
- Some other person — 5%
The Demographics of Survey Respondents
Want to know who answered our meal delivery service survey?
Gender and Household
Most respondents — 96%, evenly divided — self-identified as male or female, with the remaining self-identifying as non-binary or genderfluid.
- 49% were women
- 47% were men
- 3% were non-binary
- 1% did not provide a response.
Most meal delivery service users were married or single and never married. This is the breakdown of the relationship status of the survey respondents.
- 49% were married.
- 25% were single, never having been married.
- 8% were single but cohabiting with their significant other.
- 6% were in a domestic partnership or civil union.
- 6% were divorced.
- 4% were separated.
- 1.5% were widowed.
Geography
In terms of regional representation across the U.S.,
- 22% of survey respondents were from the Pacific region.
- 16% were from the South Atlantic region.
- 15% were from the Middle Atlantic region.
- 15% were from the East North Central region.
- 10% were from the West South Central region.
- 8% were from the West North Central region.
- 6% were from the Mountain region.
- 6% were from the East South Central region.
- 3% were from the New England region.
The vast majority of respondents lived in California (18%), New York (7%), Texas (7%), and Florida (8%), but most regions were represented. Here is the breakdown (based on respondents who answered this question):
Alabama2.14%Alaska0.19%American Samoa0.00%Arizona2.53%Arkansas0.58%California17.51%Colorado1.17%Connecticut1.36%Delaware0.00%District of Columbia (DC)0.19%Florida7.59%Georgia1.56%Guam0.19%Hawaii0.97%Idaho0.58%Illinois4.67%Indiana1.36%Iowa1.17%Kansas0.58%Kentucky1.36%Louisiana0.78%Maine0.00%Maryland1.56%Massachusetts2.33%Michigan3.50%Minnesota1.95%Mississippi1.17%Missouri1.75%Montana0.19%Nebraska0.39%Nevada1.56%New Hampshire0.19%New Jersey3.31%New Mexico0.00%New York7.20%North Carolina3.11%North Dakota0.39%Northern Marianas Islands0.00%Ohio3.50%Oklahoma1.56%Oregon0.58%Pennsylvania2.92%Puerto Rico0.00%Rhode Island0.00%South Carolina0.78%South Dakota0.00%Tennessee1.95%Texas7.00%Utah0.39%Vermont0.00%Virginia1.56%Virgin Islands0.00%Washington2.33%West Virginia0.58%Wisconsin1.56%Wyoming0.19%
Current Occupation
Our survey respondents came from all walks of life. Here is the breakdown by occupation.
Management Occupations4.05%Business and Financial Operations Occupations6.36%Computer and Mathematical Occupations5.78%Architecture and Engineering Occupations3.28%Life, Physical, and Social Science Occupations2.89%Community and Social Service Occupations1.93%Legal Occupations1.16%Education, Training, and Library Occupations9.25%Arts, Design, Entertainment, Sports, and Media Occupations4.05%Healthcare Practitioners and Technical Occupations6.74%Healthcare Support Occupations5.78%Protective Service Occupations1.54%Food Preparation and Serving Related Occupations4.24%Building and Grounds Cleaning and Maintenance Occupations1.16%Personal Care and Service Occupations2.12%Sales and Related Occupations8.48%Office and Administrative Support Occupations4.43%Farming, Fishing, and Forestry Occupations1.35%Construction and Extraction Occupations1.16%Installation, Maintenance, and Repair Occupations0.77%Production Occupations2.12%Transportation and Materials Moving Occupations2.89%Other (including homemakers, students, retired, unemployed)18.50%
Left to Their Own Devices (How Did People Order?)
Finally, we wanted to know which devices people used to order meal delivery services. The vast majority (97%) used either an Apple or Android device, with a few people using desktops.
- 58% used an iOS phone or tablet.
- 35% used an Android phone or tablet.
- 5% used a Windows desktop computer or laptop.
- 1% used a MacOS desktop computer or laptop.
- No one used “Other” phone or tablet.
Methodology and Caveats
This survey was administered through Survey Monkey on April 15th and 16th, 2022. The highest number of responses received — that is, no one skipped the question — was 1,033. Ideally, our next meal delivery survey will have a larger pool of respondents and better representation from more states and territories. It may also be a good opportunity to find out from meal delivery service users just how big a part the pandemic actually played.
Meal Delivery Services and Meal Kit Market: In Closing
As COVID-19 restrictions are gradually lifting all around the world, it will be interesting to see whether meal delivery services remain as popular, get more popular, or become less popular. Will people use meal delivery services as often now that the pandemic appears to be winding down, or were meal delivery systems merely a stop-gap measure during lockdown? Will businesses — individual, chains, and franchises — be able to take over their own delivery services? What will they have to do to be more attractive than established meal delivery systems, which offer a more extensive variety? We can’t wait to find out.
Other helpful guides


3 min reading


6 min reading

7 min reading